
Data analysis to decide who to talk to, with which product and when.
We work with the information your company already has (sales, CRM, point of sale, social media and conversations) and turn it into decisions for your campaigns.
Before producing a piece we review your company's data. It tells us who to talk to, with which product and at what moment.
Six stages,
one cycle.
Video is one stage, not the whole service. Scroll or tap each point to see what we do there and what you get at the end.
Assessment
We review what data the company has, where it lives and what state it arrives in.
What you get- 01
Assessment
We review what data the company has, where it lives and what state it arrives in.
Source mapQuality report - 02
Architecture and cleaning
We organize the information in one place, with clear rules on who uses it and how.
Data modelGovernance rules - 03
Analysis and models
We look for patterns: what sells together, who buys again, what predicts a purchase.
SegmentationPredictive model - 04
Insight
The conclusion in one sentence: who to talk to, with which product and when.
Actionable insightMessage per segment - 05
Campaign and production
Each piece is produced for a specific segment and goal.
ScriptPieces per format - 06
Evaluation and adjustment
We measure against the goal, compare with the previous campaign and correct the next one.
DashboardAdjustment plan
Five stations
before the script.
Without this chain there is no insight. Each station leaves the information ready for the next one.
Sources
Sales, CRM, web, point of sale and social media in one inventory.
Governance
Who can see what, how each field is named and who is responsible for it.
Cleaning
Duplicates removed, consistent formats, gaps resolved. Without this, nothing else works.
Models
Segmentation, recommendation and repurchase prediction on reliable data.
Insight
A clear conclusion that becomes the campaign brief.
Each group,
its own piece.
Segments are defined with statistical models and each one gets a piece designed for it. Hover or tap a card to see which customers it speaks to.
Customer segmentation
Sample dataEach dot is a customer.
Measuring while
the campaign runs.
We measure against the goal and adjust production while the campaign is live.
Weekly campaign results
Sample dataDotted lines mark the moments when the analysis changed production.
v1 · launch
General pieces for the whole base.
v2 · new hook
The model showed an early drop-off: the opening was redone.
v3 · new segment
A high-ticket group appeared: pieces made just for them.
The first
deliverable.
The real state of your data, measured on four fronts. It can be hired on its own and is the entry point to the rest of the service.
Sample data
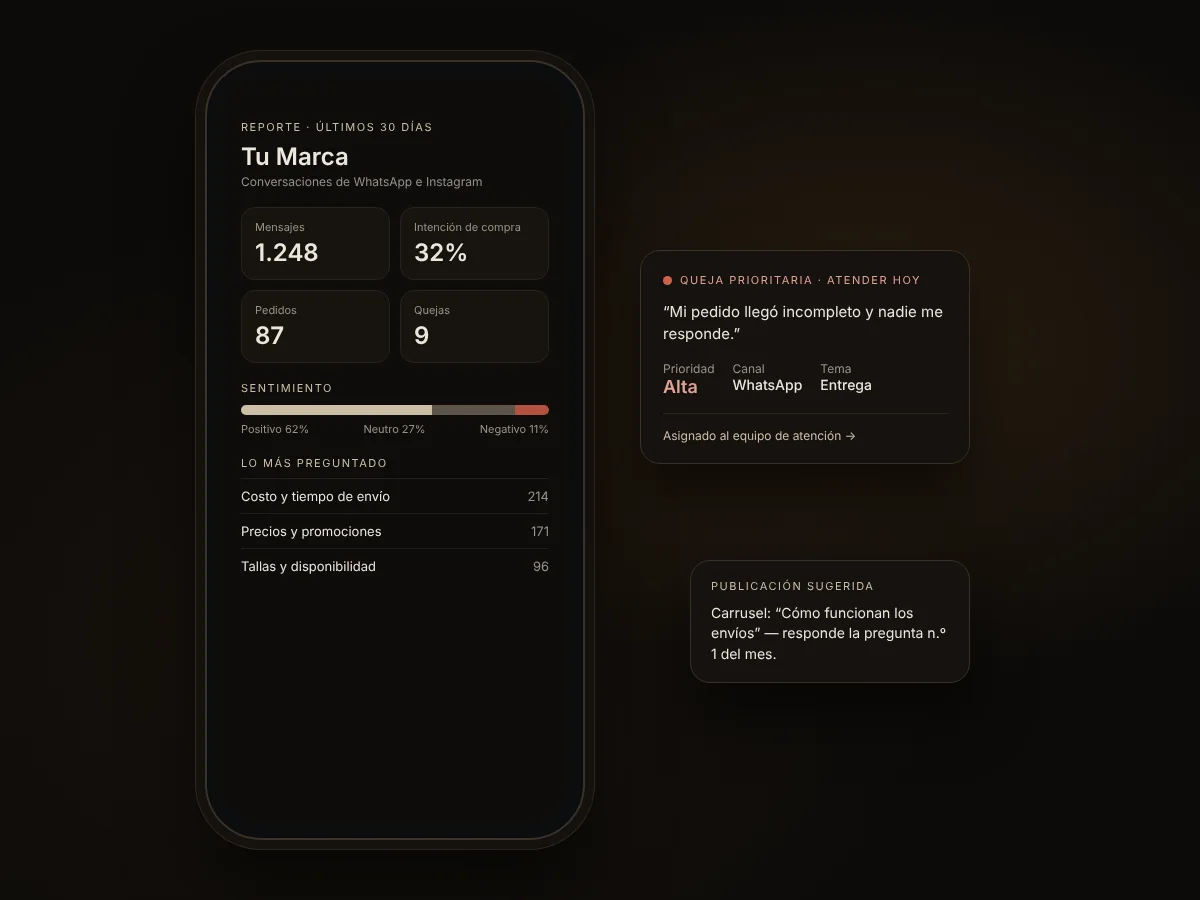
What your
customers say.
Your brand's conversations on WhatsApp and Instagram are data too. We turn them into clear information to decide what to sell, what to improve and what to communicate.
- Dashboard with the indicators of your chats
- Frequent questions and complaints, sorted by topic
- Alerts to handle the most serious complaints first
- Post ideas based on what customers ask
- Easy-to-read weekly or monthly reports
Analytics and production
in the same hands.
Analytics is not an add-on: it is the team's core training. That is why the campaign and the production come from the same analysis.
Master's in Business Analytics
Graduate training in business analytics, applied to real commercial decisions.
CRM analytics and BI
Professional experience in customer analytics, recommendation systems and executive reporting.
Models and segmentation
Cleaning, modeling and machine learning applied to customer databases, not classroom exercises.
In-house production
The same team directs, shoots and edits: the insight is not lost along the way.


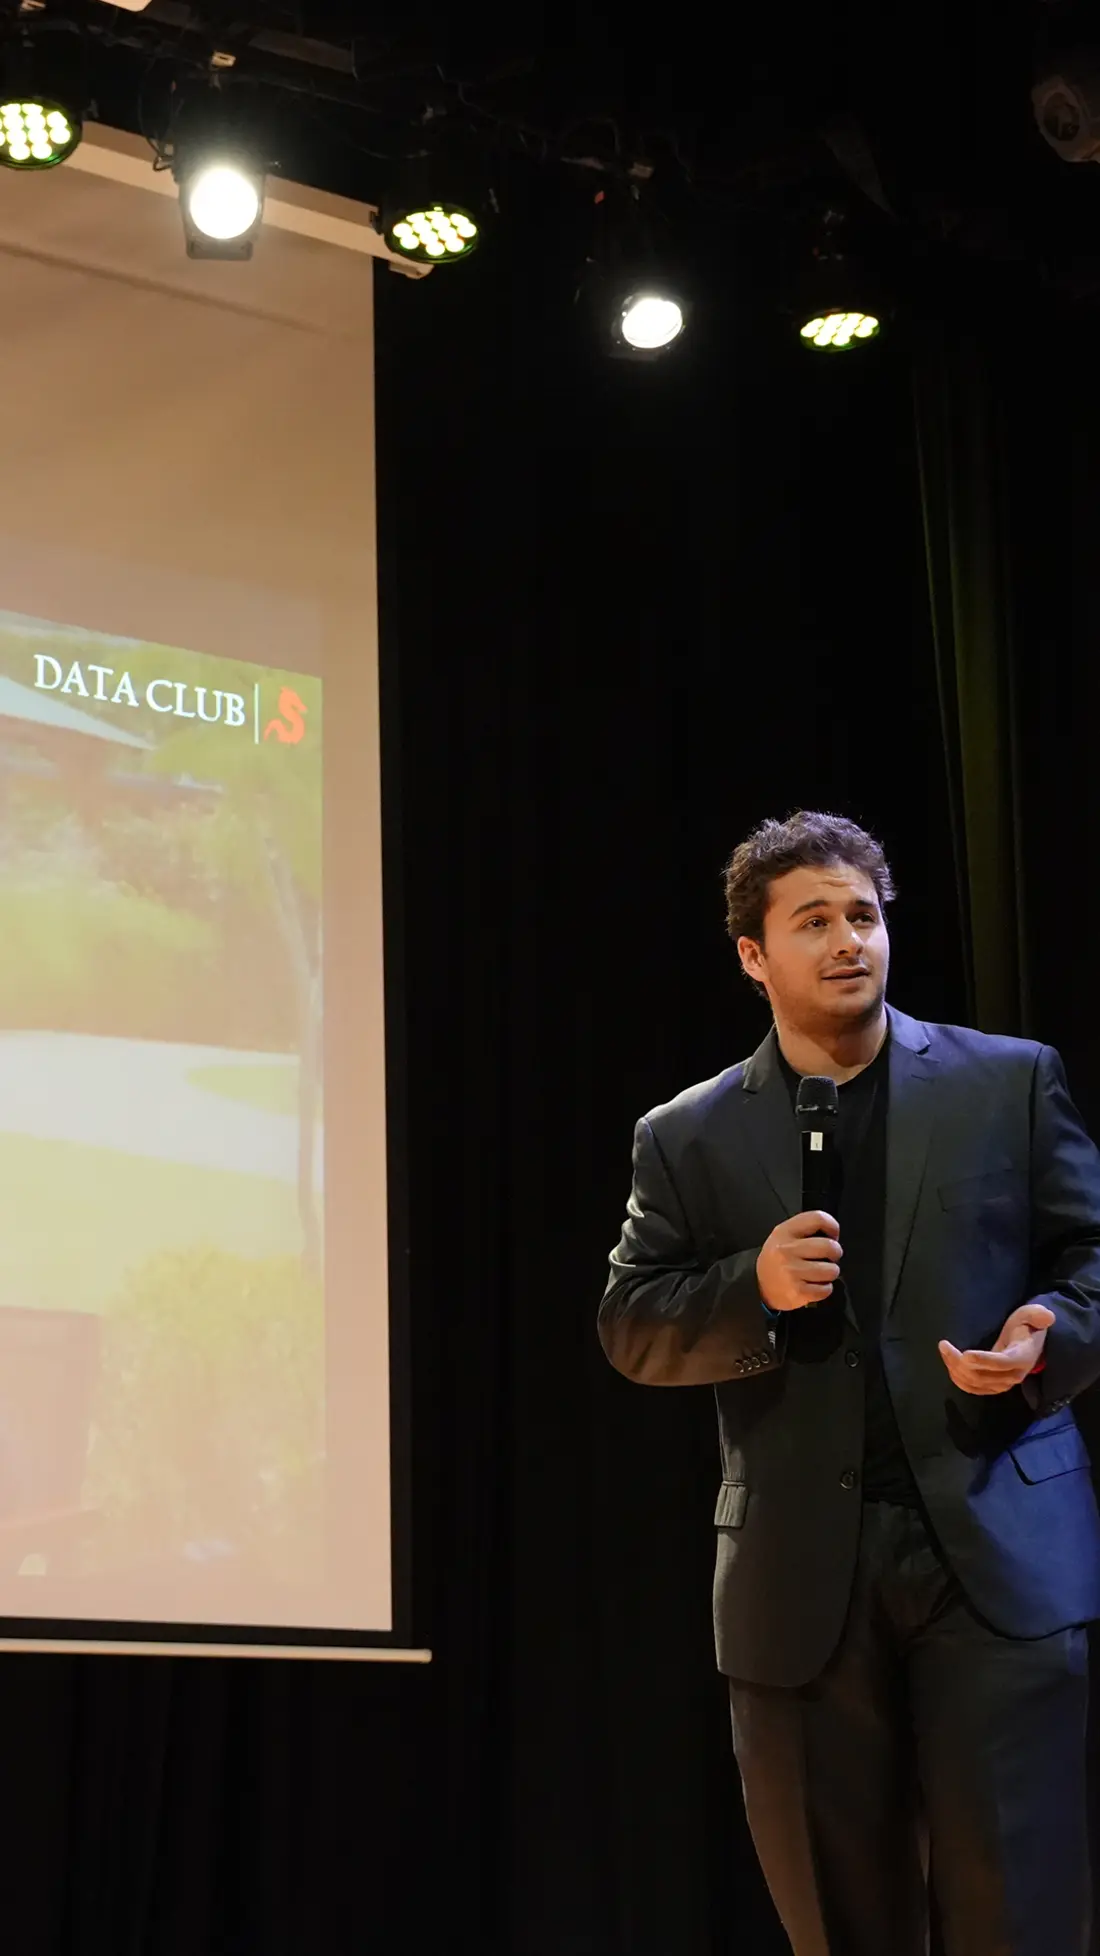
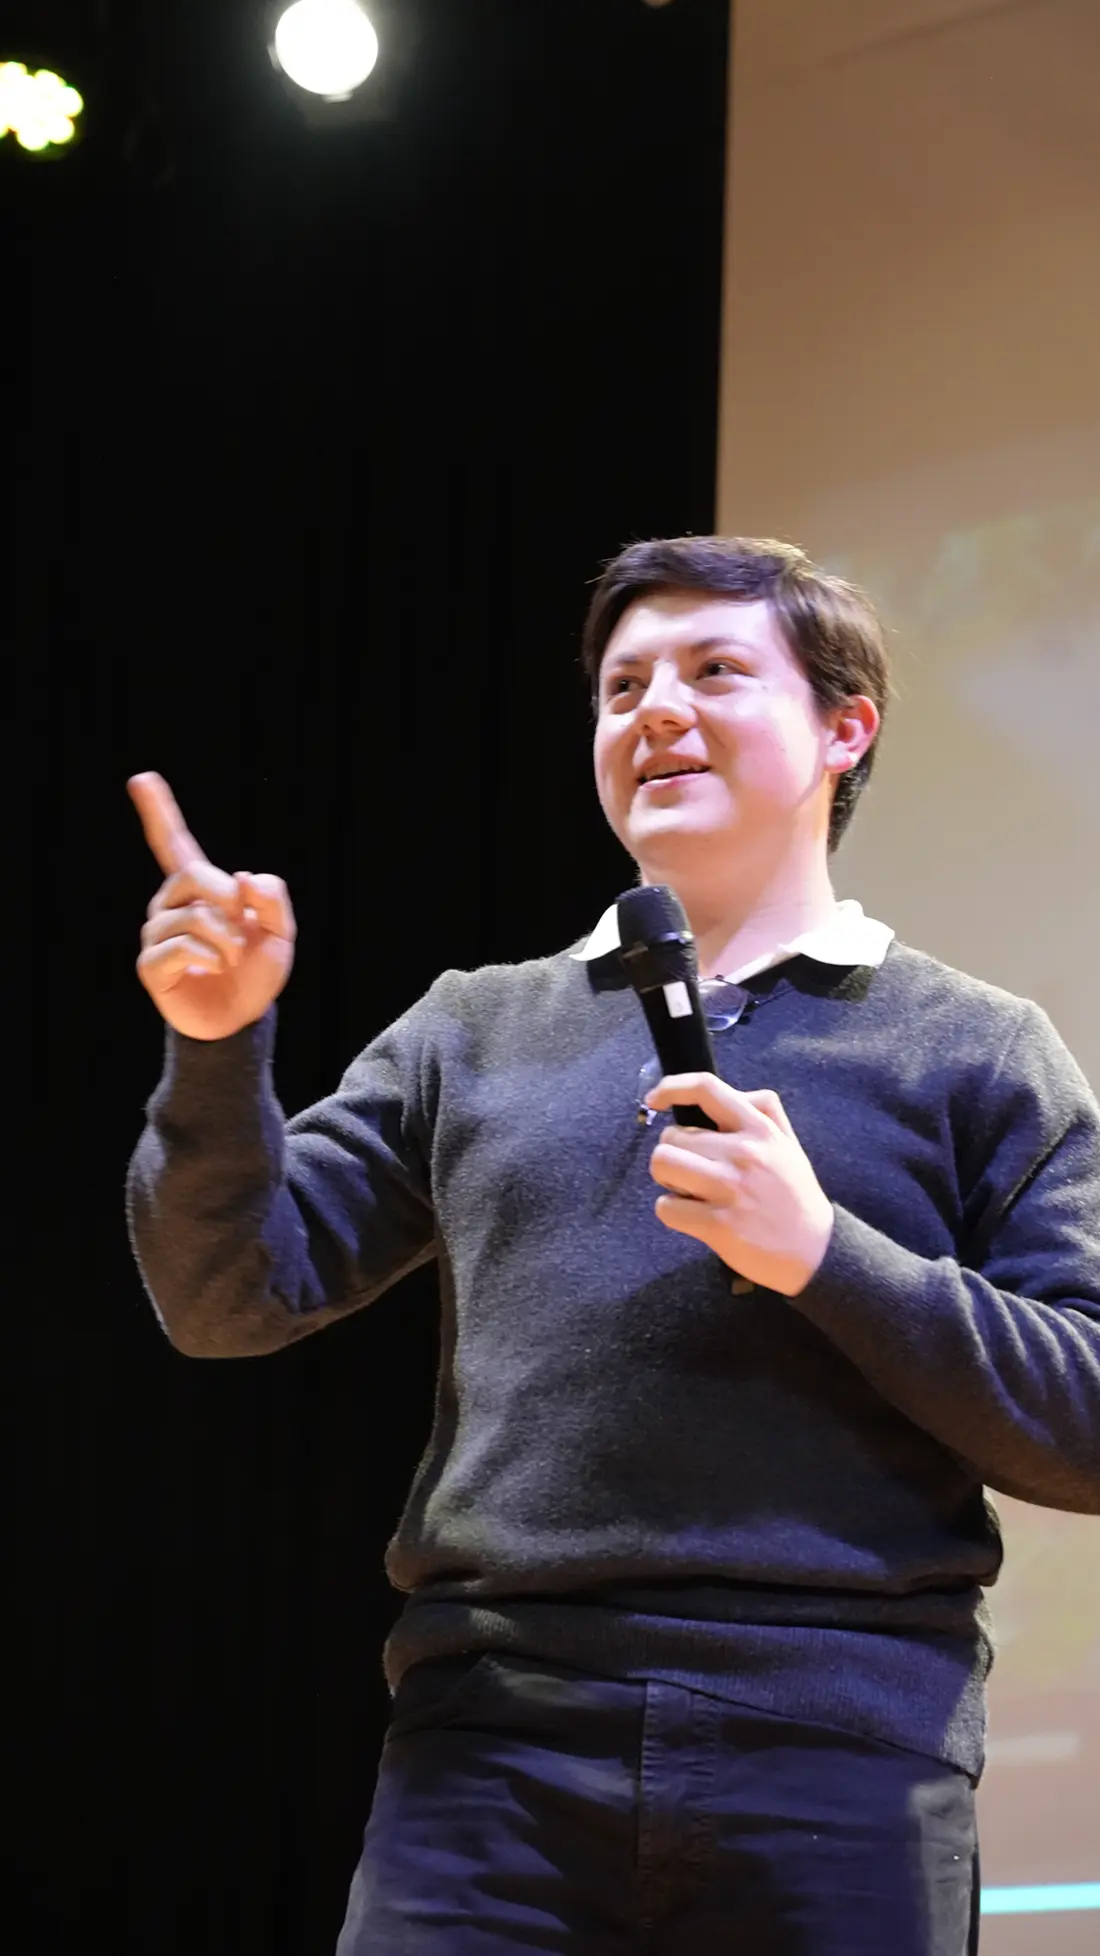
Trained at USFQ. Founders of the Data Club.
Marketing, Finance and a minor in Data Analytics, plus the Master's in Business Analytics, all at Universidad San Francisco de Quito, where we also founded the university's data analytics club.
@datausfq ↗
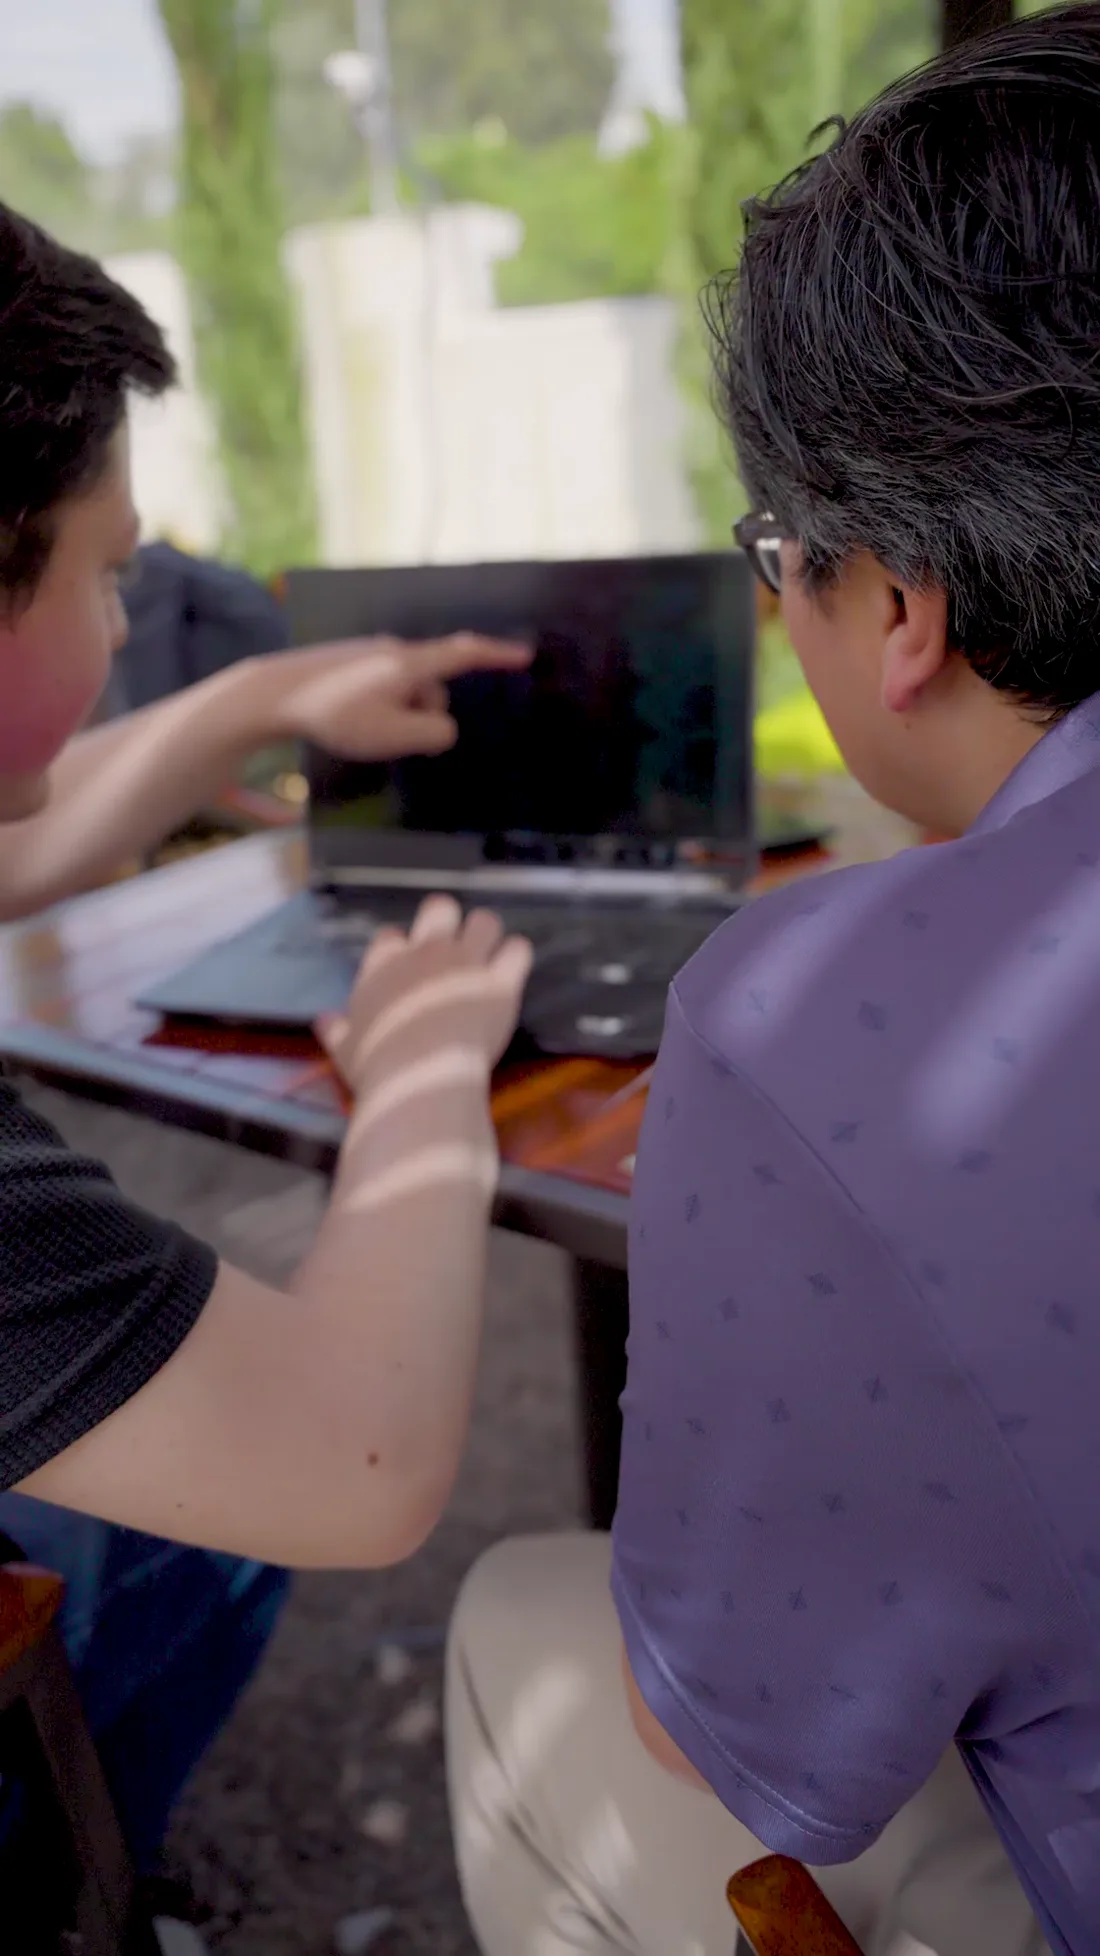
The same team that teaches data analysis produces your campaign.
What we need
from you.
No new platforms needed: we work with the systems your company already uses.
Read access
Sales or CRM, even if it is a monthly Excel export.
A business goal
Which product to move, which customer to win back, which month to lift.
A previous campaign
To compare against something and show the tracking.
Let's talk
about your data. We schedule a meeting and review where to start.